Personalized collection of plasma from healthy donors
Authors: Jan Hartmann, Michael J. Ragusa, Elmar R. Burchardt, Zorayr Manukyan, Mark A. Popovsky, Susan F. Leitman
2 MATERIALS AND METHODS
The study received IRB (WIRB Copernicus Group; Study Number: 1273259; IRB Tracking Number: 20193022) and U.S. Food and Drug Administration (FDA) IDE approvals, and the trial protocol was registered on clinicaltrials.gov (NCT04320823). The clinical trial compared plasmapheresis for source plasma collection with use of the current simplified nomogram with the novel PPN with personalized target volume calculation. The trial was overseen by a data monitoring committee under Dr. Harvey Klein’s leadership.
2.1 Participants
The participants were donors who met the donation criteria per the International Quality Plasma Program (IQPP) standards. The study enrolled plasma donors at three plasma collection centers in the United States (Charlotte, NC; Spokane, WA; Wichita, KS) from January 6 to March 26, 2020.
2.2 Inclusion criteria
Donors were qualified to donate plasma per individual site’s screening procedures in compliance with IQPP standards. If donors did not meet inclusion criteria at later donation attempts but had already been enrolled, they were eligible to remain in the clinical trial and to subsequently donate plasma once they met eligibility criteria again, unless they were permanently excluded (see below).
2.3 Exclusion criteria
All subjects meeting any of the following exclusion criteria were permanently excluded from the clinical trial: (1) subject not able or unwilling to give consent to participate; (2) subject donated plasma outside of the present clinical trial after enrollment; (3) subject withdrawn due to safety concerns by qualified healthcare providers; and (4) subject for whom a BMI for use in the PPN feature could not be reliably calculated.
2.4 Randomization
Donors were randomly assigned (1:1) to the experimental procedure (plasmapheresis using NexSys PCS® with Persona® technology, including the PPN feature, Haemonetics Corporation, Boston, MA) or the control procedure (plasmapheresis using NexSys PCS® with YES® technology, Haemonetics). After providing electronic informed consent, subjects were assigned to either group. A block randomization procedure with variable block sizes was used, targeting equal allocation of donors to each group per site and stratifying by the donors’ first-time donor status, as well as the expected number of repeat donations. The original group assignment of donors was maintained for subsequent donations, and they remained in the clinical trial per institutional guidelines until enrollment was completed or they withdrew consent. There was no re-randomization for repeat donors.
2.5 Plasma collection
Plasma collections were carried out according to the novel PPN (experimental) or the current simplified nomogram (control). To minimize bias, members of the sponsor study team remained blinded along with donors, although it is possible that some donors, particularly more experienced repeat donors, may have been able to determine to which group they had been assigned based on procedure time.
The new PPN feature employs a combination of weight, height, and hematocrit to calculate the donor’s TPV. The plasma collection volume was set at 28.5% of the donor’s TPV, with a cap of 1000 ml.
2.6 Standard treatment
The standard (control) procedure consisted of plasmapheresis using NexSys PCS® with YES® technology (Haemonetics). YES® technology optimizes plasma collection to enable utilization of the upper limit of the volume of plasma allowed by the FDA nomogram rather than the upper limit of the total collection volume (including anticoagulant). YES® and Persona® technology both target actual plasma collected by using donor hematocrit and the ratio of added anticoagulant to determine the final amount of anticoagulant in the plasma product and monitor anticoagulant usage during collection.
2.7 Outcome measures
The primary endpoint of the clinical trial was the incidence rate of at least one significant hypotensive (vasovagal/hypovolemia) AE per collection according to the plasma centers’ AE reporting systems, based on modified IQPP definitions.
For this clinical trial, a hypotensive AE was determined to be significant if it fulfilled one or more of the diagnostic signs, symptoms, or findings defined in categories 1.2, 1.3, 1.4, 1.5, or 1.6 of the IQPP classification (Table S1), as applied in the plasma centers’ AE reporting systems. TPV collected per procedure was assessed as a secondary endpoint.
2.8 Statistical analysis
The sample size was calculated based on an extensive Monte-Carlo simulation study. The historic data on significant hypotensive AE rates, study population demographics, first-time donor status, donation frequency, and so forth, were analyzed to inform the simulation study. Various AE rates were hypothesized to evaluate the operating characteristics of the design (Type 1/ Type 2 error profiles). Type 1 error rates were controlled at the significance level of 5% with a target power of at least 80%, where AE rates were assumed to be similar between the control and experimental arms. The target sample size was approximately 24,000 donations, which were expected to be contributed by around 5000–6000 donors.
The primary analysis was conducted on the intention to treat (ITT) data set and assessed and compared the incidence rate of at least one significant hypotensive AE per donation across two clinical trial groups (control vs. experimental). The primary endpoint compared across the two groups was the incidence rate of at least one significant hypotensive AE according to the plasma center AE reporting system, based on modified IQPP definitions.
The primary analysis consisted of a model-based estimation of the incidence rates of significant hypotensive AEs per donation in the two study groups and tested the hypothesis that the incidence rate in the experimental group is not inferior to that in the control group at a significance level of α ≤ 0.025 using a noninferiority (NI) margin of 0.15%, which was selected based on the historic rate of significant hypotensive AE rates,10 and an allowable margin agreed upon with the FDA.
The analysis was performed using generalized estimation equations logistic regression (GEE Logistic) framework for correlated repeat measures. The nonrandom variables (fixed effects) used to predict the occurrence of a significant hypotensive AE for each donation were group (control or experimental), sex, donor status (first-time donor or repeat donor), age, and BMI. A sensitivity analysis incorporating site as a variable was performed; however, as it was not a significant factor, this was not added as an adjustable variable. Exchangeable correlation structure (also known as “compound symmetry assumption”) was used for model-fitting to capture donor level variability in which within-donor observations were assumed to be equally correlated. The 95% confidence intervals of predicted significant hypotensive AE incidence rates in both the control and experimental groups were calculated using the Agresti-Coull method,11 whereas the 95% confidence interval of the difference between the control and experimental groups was calculated using the Agresti-Caffo method.12
3 RESULTS
3.1 Study population
A total of 3443 plasma donors were consented and enrolled at three sites, consisting of 1726 donors and 11,775 donations in the control group and 1717 donors and 11,362 donations in the experimental group. Baseline characteristics between the control and experimental group were generally well balanced (Table 1). The ITT data set was defined as all study donations where randomization was completed and the apheresis procedure was initiated. See Table S2 for population summaries and Figure 1 for visualization.
| Parameter | Control | Experimental | Overall |
|---|---|---|---|
| Age, mean (SD), y | 35.4 (11.10) | 35.5 (11.69) | 35.4 (11.40) |
| Female, No. (%) | 601 (34.8) | 605 (35.2) | 1206 (35.0) |
| Male, No. (%) | 1125 (65.2) | 1112 (64.8) | 2237 (65.0) |
| Weight, mean (SD), lb | 206.1 (51.33) | 207.5 (50.99) | 206.8 (51.16%) |
| BMI, mean (SD) | 31.8 (7.75) | 32.1 (7.74) | 32.0 (7.74) |
| Repeat donor, No. (%) | 1618 (93.7) | 1608 (93.7) | 3226 (93.7) |
| First-time donor, No. (%) | 108 (6.3) | 109 (6.3) | 217 (6.3) |
| Hematocrit, mean (SD), % | 45.4 (3.77) | 45.5 (3.81) | 45.5 (3.79) |
- Abbreviations: BMI, body mass index; ITT, intention to treat; SD, standard deviation.
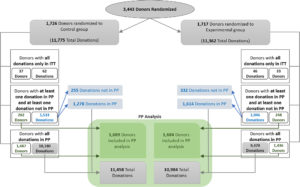
FIGURE 1
The per-protocol (PP) population was defined as all donations where the apheresis procedure was successfully completed, collecting at least 90% of the target plasma volume, as well as all donations associated with a significant hypotensive AE. The PP data set consisted of 1689 donors and 11,458 donations in the control group and 1684 donors and 10,984 donations in the experimental group.
3.2 Primary clinical outcome
Ten significant hypotensive AEs were observed (six in the control group; four in the experimental group) in 10 unique donors (Figure 2). Table 2 lists the number and type of observed significant hypotensive AEs for the ITT population, in addition to the reasons for donor deferral or withdrawal, where applicable. Table S3 lists the number and type of the AEs by site and study group. One significant hypotensive AE (AE #10; Category 1.4 Hypotensive) was reported as a delayed reaction. All other AEs occurred and were recorded on-site during or immediately after the procedure. Of the 10 donors who experienced significant hypotensive AEs, four were cleared to continue in the study, two were given a temporary deferral, two were permanently deferred, and two were withdrawn from the trial by the principal investigator.
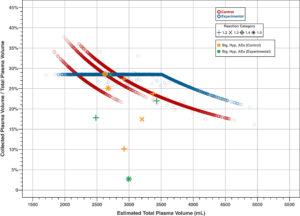
FIGURE 2
| AE # | Study arm | Grade | Sex; age (years) | BMI | Collection cycle # | Symptoms (most severe, category defining symptom highlighted in bold) | Status |
|---|---|---|---|---|---|---|---|
| 1 | Control | 1.5 | F; 29 | 39.7 | 3 | Discomfort (palpitations, dizziness, sweating); loss of consciousness for <60 s; drooling and very brief tensing of extremities, observed by center staff and interpreted as seizure activity | Withdrawn by PI |
| 2 | Control | 1.2 | M; 33 | 32.4 | 2 | Discomfort (nausea) resulting in vomitus (spitting into emesis bag); no other signs observed by staff | Continue |
| 3 | Experimental | 1.3 | F; 52 | 31.9 | 5 | Discomfort (nausea, warmth, sweat beads on forehead); procedure paused (with ice packs applied and donor fanned, nausea resolved in <5 mins). Fifteen minutes later, vomitus; unsuccessful attempt to start IV; another 20–30 secs. LOC during repeated, successful IV placement | Withdrawn by PI |
| 4 | Control | 1.2 | F; 44 | 42.9 | 4 | Discomfort (dizziness, lightheadedness, sweating, epigastric distress); vomitus | Temporarily deferred |
| 5 | Control | 1.3 | M; 43 | 48.4 | 5 | IV infiltration necessitating restick; two unsuccessful attempts, loss of consciousness for < 60 s during third attempt | Temporarily deferred |
| 6 | Control | 1.2 | M; 22 | 35.3 | 6 | Discomfort (warmth, weakness, pallor, lightheadedness, sweating); vomitus | Continue |
| 7 | Experimental | 1.2 | M; 55 | 46.4 | 6 | Discomfort (chills then warmth, weakness, pallor, lightheadedness and nausea); two episodes of vomitus | Continue |
| 8 | Experimental | 1.5 | M; 22 | 27.8 | 1 | Discomfort (warmth, sweating, dizziness, pallor); loss of consciousness for <60 s; myotonic jerking of upper extremities, bending both arms into chest, arching of back, lasting only a few seconds. No urinary incontinence. Donor room staff assessed this as seizure activity. No hypotension documented | Permanently deferred |
| 9 | Experimental | 1.2 | F; 37 | 30.0 | 3 | Discomfort (sweating pallor); vomitus | Continue |
| 10 | Control | 1.4 | F; 38 | 27.0 | 4 | Discomfort after leaving the donor center (lightheadedness, dizziness); LOC > 1 min; no reports of vomitus or seizure activity | Permanently deferred |
- Abbreviations: AE, adverse event; BMI, body mass index; IV, intravenous; LOC, loss of consciousness; PI, principal investigator.
There was no difference between the model-based estimation of the incidence rates of significant hypotensive AEs per donation between the two groups, based on the hypothesis that the incidence rate in the experimental group was not inferior to that in the control group at a significance level of α ≤ 0.025, using an NI margin of 0.15%. NI was demonstrated with a more stringent margin of 0.043%. The model-based estimates (with 95% CI) of incidence rates were 0.051% (0.020%–0.114%) and 0.035% (0.010%–0.094%) for the control and experimental groups, respectively (p = .57; Table S4).
Sensitivity analysis was performed to assess the incidence rates per study group based on observed sample means. This analysis was similar to the model-based estimates.
3.3 Secondary clinical outcome
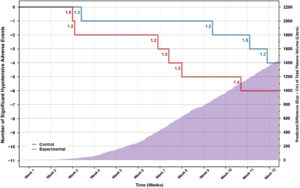
For the plasma collected per procedure, the model-based estimate (with 95% CI) for the PP population was 777.8 ml (625–801) for the control group and 841.7 ml (636–1000) for the experimental group. On average, 63.9 ml (8.2%) more plasma was collected in the experimental group (p < .0001). Sensitivity analysis based on the observed sample means estimates agreed with the model-based analysis, yielding estimates of 778.2 ml (control) and 841.3 ml (experimental) as shown in Table 3. For the control group, a total of 8916.5 L plasma was collected, compared with 9241.1 L for the experimental group. The predicted number of significant hypotensive AEs, relative to 10,000 L of collected plasma, was 6.65 (control) and 4.27 (experimental; p = .245). The cumulative difference between the control and experimental group in both the number of significant hypotensive AEs and the predicted TPV collected throughout the study is shown in Figure 3. A similar pattern of incomplete donations (due to hypotensive AEs) and hypotensive AEs associated with incomplete donations was observed between the control and experimental groups.
| Study groups | Control (A) | Experimental (B) | Δ (B-A) |
|---|---|---|---|
| Number of donors | 1689 | 1684 | – |
| Number of donations | 11,458 | 10,984 | – |
| Observed sample mean of collected plasma (with Z-test) | 778.2 | 841.3 | 63.1 [60.9, 65.3] |
| p-value | – | – | <.0001 |
| Model-based estimates of collected plasma with 95% CIa | 777.8 [625, 801] | 841.7 [636, 1000] | 63.9 [62.8, 64.9] |
| p-value | – | – | <.0001 |
- Abbreviations: CI, confidence interval; PP, per protocol.
- a Model-based estimates and confidence intervals of collected plasma were calculated based on predicted plasma volume on the entire study population.
4 DISCUSSION
An increasing number of drugs and medicinal products (e.g., immunoglobulins, alpha-1-proteinase inhibitor, fibrinogen, fibrin sealants, clotting factors) rely on plasma as the source material, collected as source plasma by apheresis from donors at dedicated collection centers. The diverse therapeutic functions of plasma-derived medicinal products mean they are of benefit in treating an extensive range of chronic disease states, with increasing numbers of patients suffering from diseases and disorders that are treatable through plasma products. Recently, convalescent plasma was identified as a potential therapeutic for COVID-19, with early administration of high-titer convalescent plasma reducing the disease progression in older adults, which could lead to increased demand in addition to the supply disruptions and reduced donor numbers caused by the pandemic. With plasma supply under increased pressure, solutions to the potential shortage of plasma supply are urgently needed, but they must not impair the high safety standard that has been achieved over past decades.
Plasmapheresis is currently established as one of the safest procedures in medicine, with an unprecedented track record involving tens of millions of donations per year. The procedure is associated with low incidences of AEs in donors, particularly repeat donors, with an expected incidence of significant hypotensive AEs of 0.15%, and the historic rate of severe reactions even lower, at 0.03%.
Despite this, there is an opportunity for improvement in terms of the plasma volume that can be safely collected from individual donors, which would increase the overall amount of plasma collected. This could potentially increase the risk of plasma protein loss. However, sustained serum protein depletion can be avoided with a frequent assessment of serum protein levels (routine practice).
The current nomogram for plasma collection published by the FDA’s Center for Biologics Evaluation and Research in 1992 has been used by source plasma collectors for nearly 30 years and allows a maximum plasma collection of 800 ml. Field experience has demonstrated that collections following this nomogram are safe, with a significant hypotensive AE rate of approximately 0.15%, according to the plasma centers’ AE reporting system, based on IQPP definitions. However, it has been suggested that collection of 1000 ml may be safe and would not lead to sustained plasma protein depletion. Due to the very low event rate of 0.15% for significant hypotensive AEs, the large-scale trial design described here represents the necessary approach to demonstrate that the PPN is non-inferior to the current nomogram and offers the additional benefit of increased plasma collection.
The primary analysis of this study was therefore to test the NI of the safety of the experimental group versus the control group with regard to the incidence rate of significant hypotensive AEs. Primary analysis data suggest NI of the experimental arm, which was met at a more stringent margin than the predefined margin.
As expected, the control group showed three distinct plasma volume groups categorized by donor weight (625; 750; 800 ml), whereas the experimental group showed a consistent weight, height, and hematocrit-based yield of 28.5% of donor total plasma volume, up to a maximum of 1000 ml collected plasma volume. The occurrence of significant hypotensive AEs was, in most cases, associated with the collection of lower plasma volumes than intended because the occurrence of these events prevented the further collection of plasma up to the target volume. Importantly, none of the significant hypotensive AEs in the experimental arm occurred at collection volumes exceeding those permissible under the current nomogram. The pattern of incomplete donations and significant hypotensive AEs between the two groups was similar (Figure).
As enrollment continued, the cumulative collected plasma volume in the experimental group remained consistently larger than in the control group, whereas the cumulative number of significant hypotensive AEs in the experimental group never exceeded that in the control group. This suggests that there was no tendency for higher collection volumes to result in a greater number of significant hypotensive AEs in the experimental group. Although the volume of collected plasma was lower than in the current study, a previous report has suggested that increasing the collected target volume to 850 ml in donors weighing at least 70 kg did not result in an increased dropout rate in comparison with the lower-weight group that donated 750 ml.
The secondary endpoint showed that significantly increased plasma volume was collected in the experimental group compared with the control group.
The data presented here demonstrate for the first time that plasma collections of up to 1000 ml can be conducted safely in some donors using a novel plasma collection nomogram. Furthermore, the study is the first of its kind and of this scale to provide prospectively collected AE frequency data for donor plasmapheresis in a real-world setting.
In summary, use of the PPN is associated with a non-inferior safety profile, with no safety signal detected in prespecified subgroups known to be at an increased risk of developing a significant hypotensive AE, whereas the volume of plasma collected is significantly increased.
5 LIMITATIONS
There are several potential limitations of the study. The observed event rate of significant hypotensive AEs was low (0.04% among all donations), compared with the anticipated value of 0.15%, which meant fewer AEs for comparison were collected. This could in part be due to seasonal fluctuations in event rates, which are known to be lower in winter months, and the trial data were in line with seasonal, center-specific, historic AE rates. Underreporting of significant hypotensive AEs may be another explanation.
The inability to assess the loss of plasma proteins through the increased volume and frequency of plasma donation was also a study limitation. However, following discussions with the appropriate trial review boards, it was agreed that regular plasma protein level testing as part of the donation process was sufficient to avoid critical protein depletion in plasma donors.
Lastly, donors could have been aware of the change in the duration of the procedure in the experimental arm. Repeat donors, in particular, could have inferred that they were in the PPN group and thus may not have been entirely blinded to which procedure they were undergoing. Due to the nature of the procedure, it was impossible to further blind donors to the trial procedure they were undergoing.
6 CONCLUSION
In this clinical trial, we showed that it is possible to collect approximately 8% more plasma on average per donation using the PPN, without impairing donor safety. The knowledge gained in this study may help to mitigate the pressing problem of worldwide plasma shortages. As the demand for current and future plasma-derived medicines increases over time, these findings provide a way to meet the growing need.
ACKNOWLEDGMENTS
We would like to thank the members of the Data Monitoring Committee for the IMPACT trial: Harvey G. Klein, MD (Chair); Richard M. Kaufman, MD; Waseem Anani, MD; Nancy M. Heddle, MD; and William F. Rosenberger, PhD.
CONFLICT OF INTEREST
Dr. Hartmann reports being employed by and holding equity interest in Haemonetics Corp. Mr. Ragusa reports being employed by and holding equity interest in Haemonetics Corp. and holding a related patent, assigned to Haemonetics Corp. (US 2018 / 0344910 A1). Dr. Burchardt, Dr. Manukyan Zorayr, Dr. Popovsky, and Dr. Leitman report consulting fees from Haemonetics Corp. Dr. Leitman’s opinions do not reflect the policy of the National Institutes of Health or the Department of Health and Human Services.